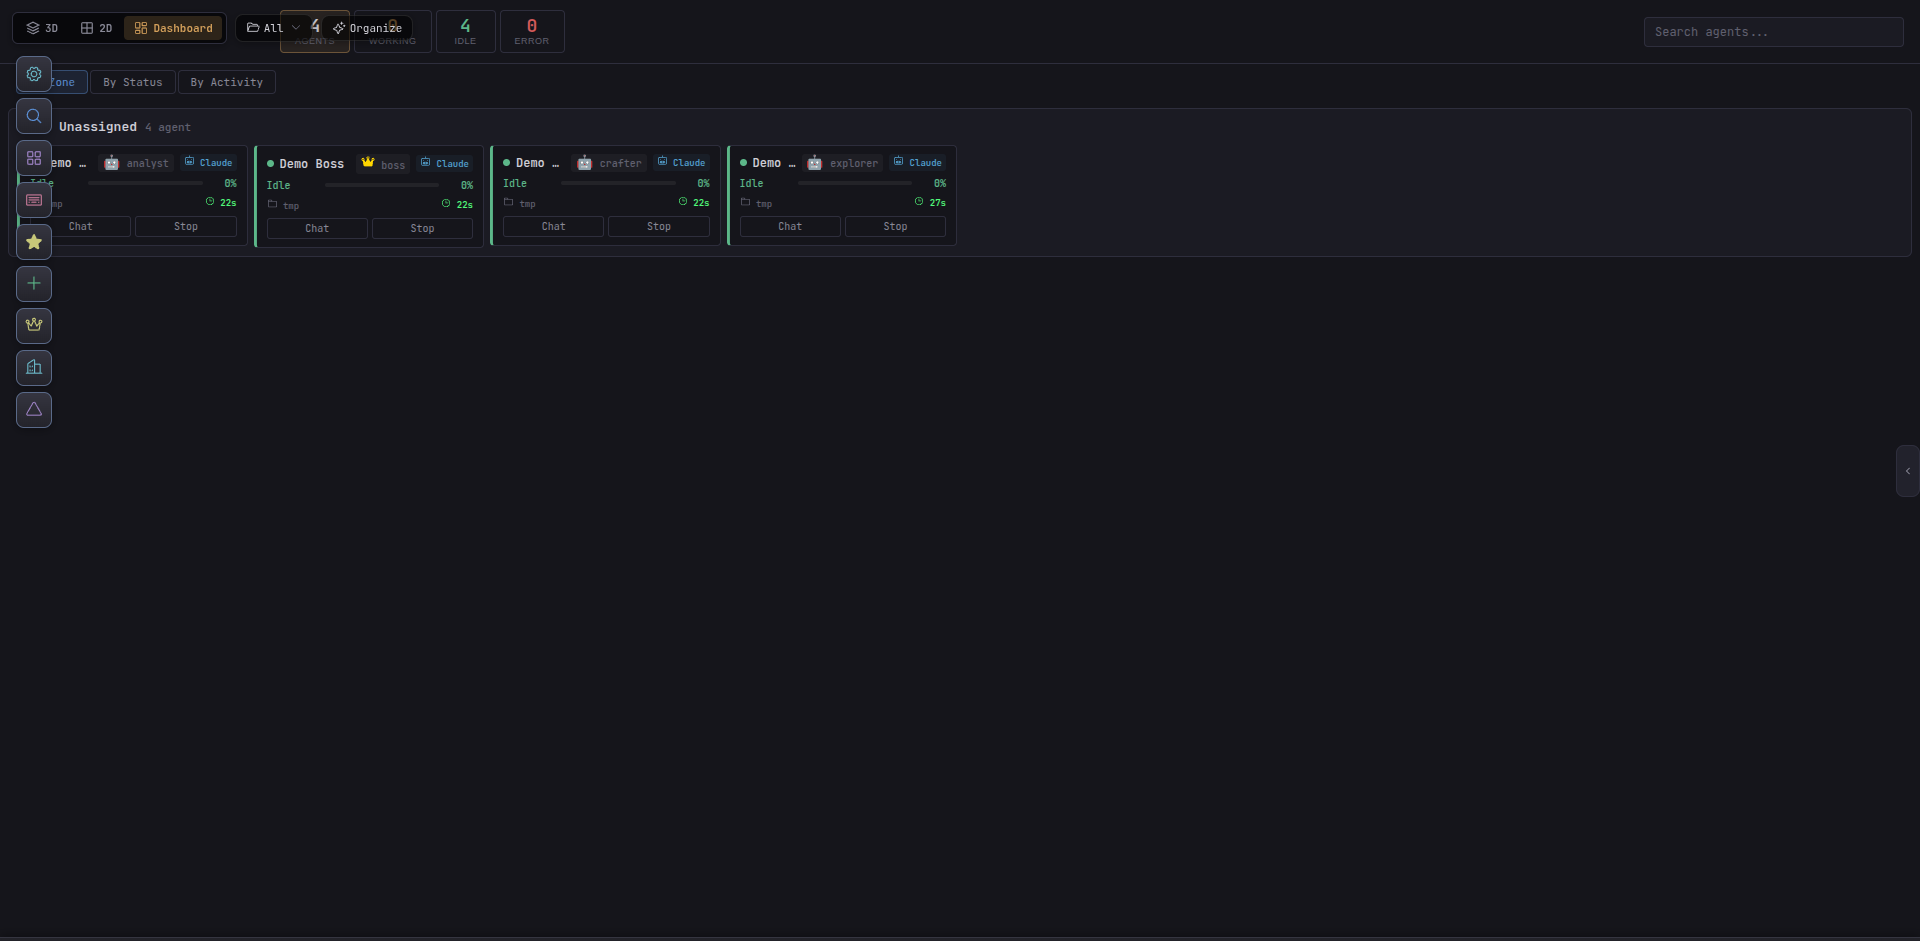
Agent cards
One card per agent: name, class, provider chip (CL/CO/OC), tracking status, current tool, context-used percentage, working directory.
The Dashboard trades the battlefield for a wall of cards. When you don’t need spatial awareness — you just need to know who’s working, who’s blocked, and what buildings are healthy — this is the view to pin on a second monitor.
Pick Dashboard from the top toolbar, or press Alt + 2 to cycle. Dashboard persists per-browser, so if you keep a second window open for always-on viewing it will stay on Dashboard even as the primary window cycles.
Agent cards
One card per agent: name, class, provider chip (CL/CO/OC), tracking status, current tool, context-used percentage, working directory.
Status totals
Roll-up counts at the top — TOTAL, IDLE, WORKING, NEED-REVIEW, BLOCKED, WAITING-SUBORDINATES. Click to filter.
Building health
Any servers, databases, Docker containers, or links you’ve placed appear with last-seen state and connection indicators.
Recent activity
A streaming log of the most recent tool calls, notifications, and tracking-status changes across the team.
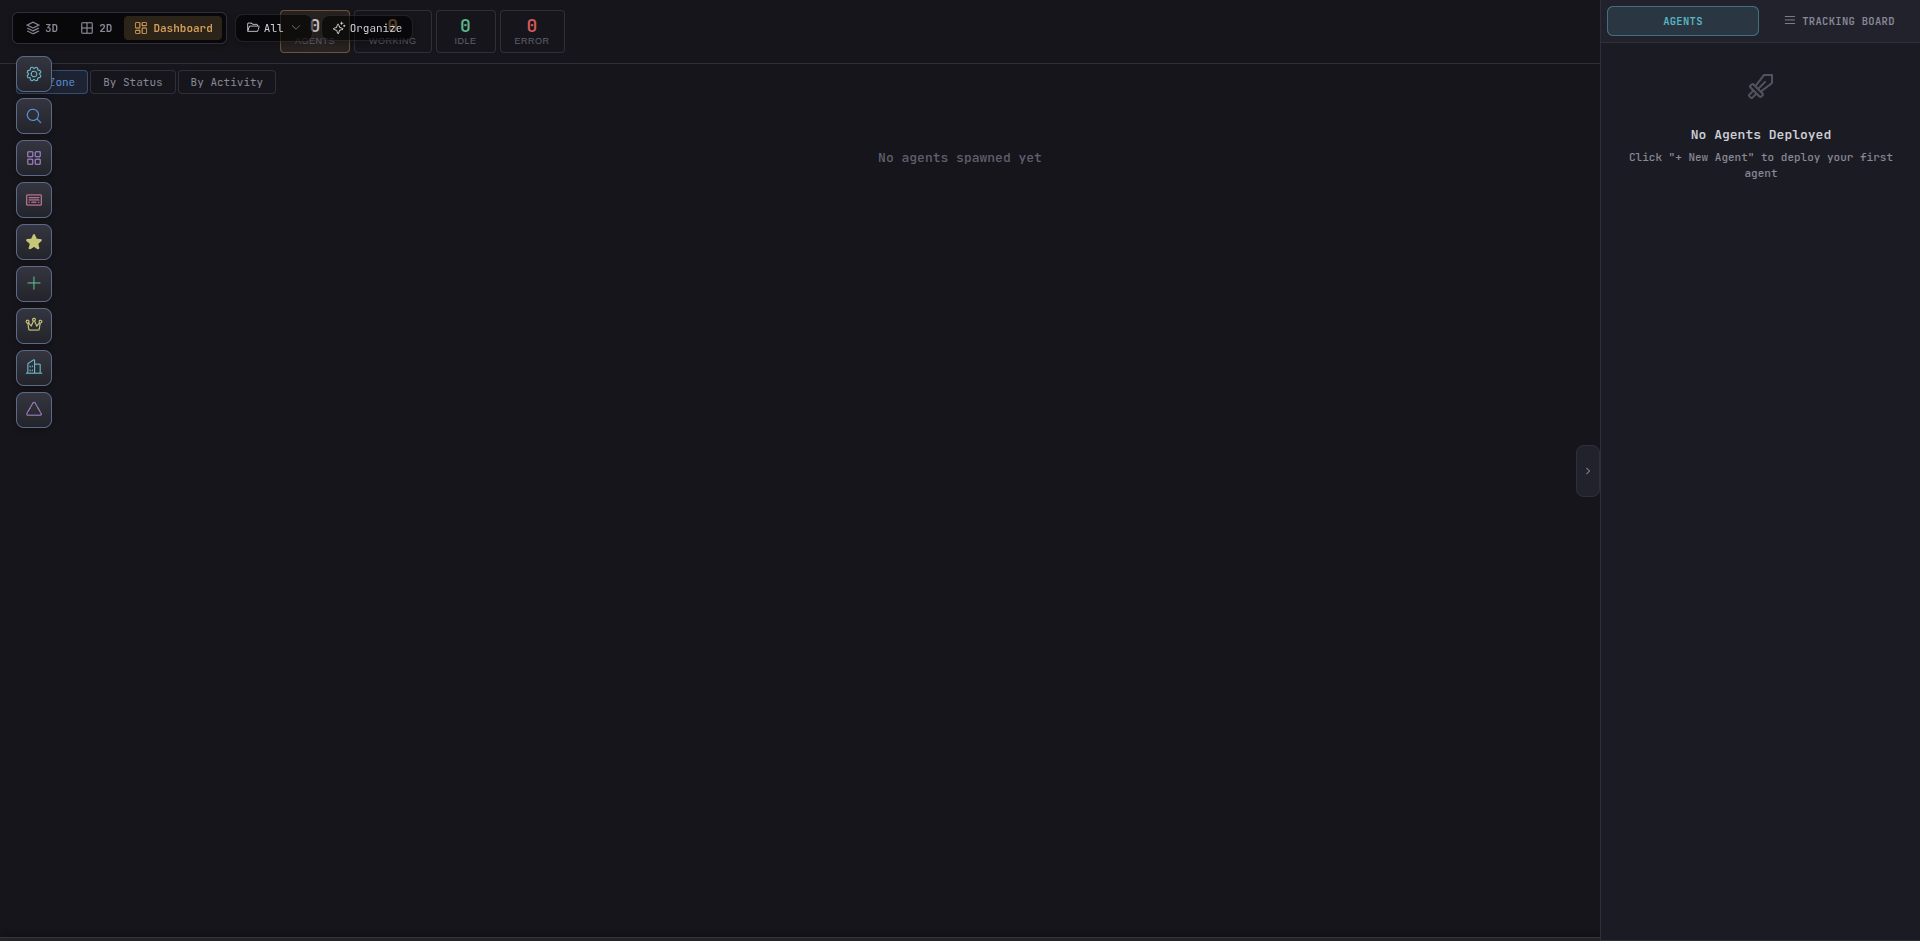
On a fresh install the Dashboard is quiet — a single “no agents yet” card with a Spawn New Agent CTA. As soon as you spawn, cards fill in left-to-right in spawn order.
blocked or need-review and who owes a report to a boss.